


MySQL Visual EXPLAIN
Transform MySQL EXPLAIN output to interactive graphs.
About MySQL Visual EXPLAIN
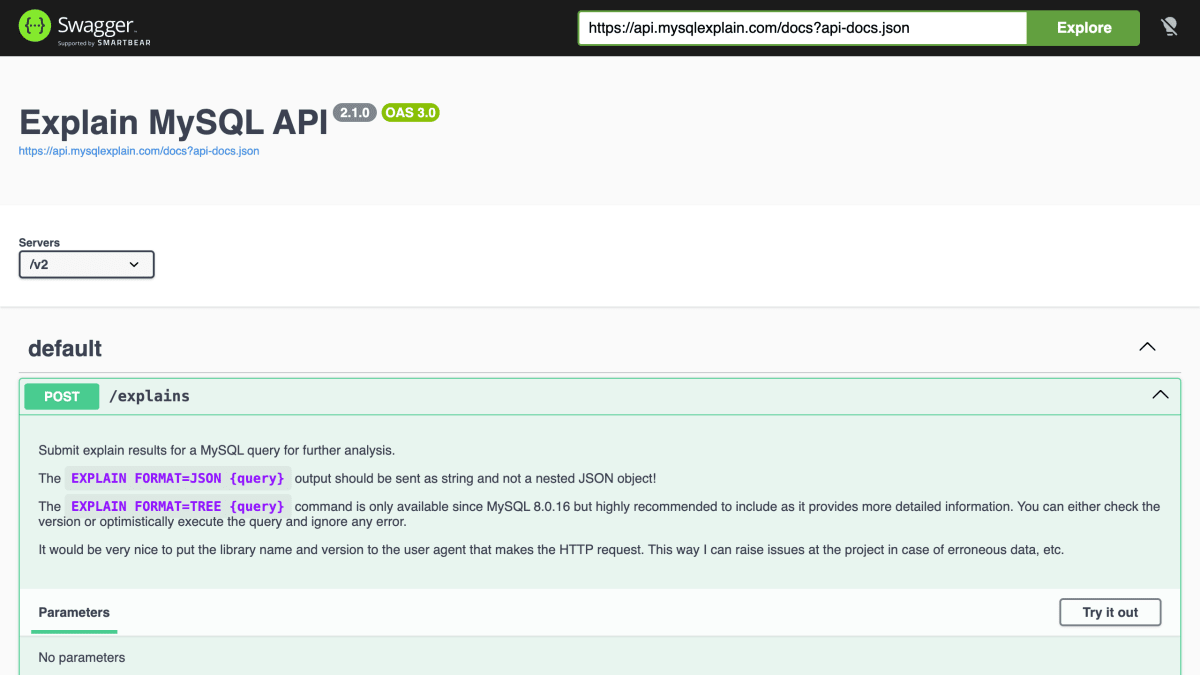
MySQL Visual EXPLAIN is an API for submitting MySQL EXPLAIN output for analysis and visualization. It accepts a query along with its EXPLAIN FORMAT=JSON and, optionally, EXPLAIN FORMAT=TREE output (the latter available since MySQL 8.0.16), and returns a URL to a hosted, shareable visualization of the explain plan. The API supports MySQL 5.6 and above and includes rate limiting, reporting limits and remaining request counts via response headers.
The service also provides an oEmbed endpoint for generating iframe embed code for a given EXPLAIN plan URL, allowing the visualization to be embedded on external websites. Embed requests can specify maximum width and height and whether a fullscreen button is shown, and the response includes both ready-made HTML and a raw embed URL for building custom iframe code.
It is intended for developers who want to analyze, visualize, and share MySQL query execution plans, including embedding them in blog posts, documentation, or other web pages.
Key features
- Submit MySQL EXPLAIN FORMAT=JSON or FORMAT=TREE output for visual analysis
- Generates a shareable URL for each EXPLAIN plan
- Provides an oEmbed endpoint to embed EXPLAIN plans as an iframe on a website
- Resizable embed iframe with optional fullscreen button
- Supports MySQL version 5.6 and above
Frequently asked questions
What MySQL versions are supported?
Only MySQL 5.6 and above is supported; submitting an unsupported version returns a 400 unsupported_database error.
How do I submit an EXPLAIN plan?
Send a POST request to /explains with the query, optional bindings, MySQL version, and the EXPLAIN FORMAT=JSON output as a string (and ideally FORMAT=TREE output too).
Can I embed an EXPLAIN plan on my website?
Yes, the GET /oembed.json endpoint returns oEmbed data including ready-made iframe HTML or a URL to build your own embed.
Is there a rate limit on the API?
Yes, responses include X-Ratelimit-Limit, X-Ratelimit-Remaining, and X-Ratelimit-Reset headers, and exceeding the limit returns a 429 Too Many Requests error.


SerpApi - Search API
SerpApi's Search API makes it easy and fast to scrape Google and other search engines.

Show your product to thousands of developers
· 100k monthly pageviews
· 7k newsletter subscribers
You might also like
Markdown to JSON API
DevelopmentUpload Markdown and get JSON with one API call.
MetaScrape
DevelopmentExtract metadata, Open Graph tags, and structured data from any URL.
MY IP
DevelopmentGet IP address information.
Nationalize.io
DevelopmentEstimate the nationality of a first name.
Netbait IP Scorer
DevelopmentNetbait is a free IP reputation API designed to help users determine whether an IP address has been involved in attacks, scanning attempts, or other malicious a.
Netlify
DevelopmentNetlify is a hosting service for the programmable web.